
Without clear comparisons and long-term visibility, it’s challenging to identify areas for improvement and make informed, data-driven decisions. That’s why we’re excited to introduce HackerOne Benchmarks, a new set of features designed to provide the insights necessary for optimizing your security program’s performance.
Our Solution: HackerOne Benchmarks
HackerOne Benchmarks allow you to measure your security program’s performance against our extensive customer base and your industry peers, while tracking progress over time to highlight trends and areas for improvement. Whether you seek high-level comparisons or detailed analysis, HackerOne’s benchmarking tools offer actionable insights by evaluating your current results against both past data and industry ranges.
With our benchmarking tools, organizations can:
- Compare their program’s performance with industry peers and monitor progress over time.
- Gain data-driven insights to identify strengths, weaknesses, and growth opportunities using insights from over half a million vulnerabilities gathered from 3,500+ security programs running on HackerOne globally.
- Use actionable data to enhance program effectiveness and maximize impact.
Enterprise customers can further customize their benchmarks, tailoring them to focus on specific metrics and peer groups for even deeper insights.
What’s Available For All HackerOne Customers
All customers can access benchmarks that compare their programs against the entire HackerOne customer base, along with year-over-year comparisons of their own program’s performance. These insights help identify areas where your program may not be meeting targets or staying competitive.
By understanding how quickly your team responds, triages, and awards bounties in relation to others, you can pinpoint specific areas for improvement and drive meaningful changes to enhance overall program performance.
Benchmark charts against HackerOne data set | Year-over-year (YoY) comparison charts |
Submissions: Compare how many submissions your program is getting.
Time to first response: Compare how quickly your team reacts to submissions.
Time to triage: Compare how quickly triage is completed on the submissions.
Time to bounty: Track how quickly you are rewarding Hackers for their efforts.
Time to close: Track how quickly you are resolving vulnerabilities.
Bounty table: See if you are offering the right level of hacker rewards.
| Submissions: Track changes to identify emerging threats and areas of focus based on submissions.
Total rewards paid: Evaluate and optimize the effectiveness of your bounty reward structure.
Hacker participation: Gauge the continued attractiveness of your program for the hackers.
Active hackers: Evaluate your program’s ability to retain and engage active hackers. |
Let’s dive into some of the most powerful charts below and explain how teams can refine their programs and attract more skilled hackers by improving efficiency, competitiveness, and overall program appeal.
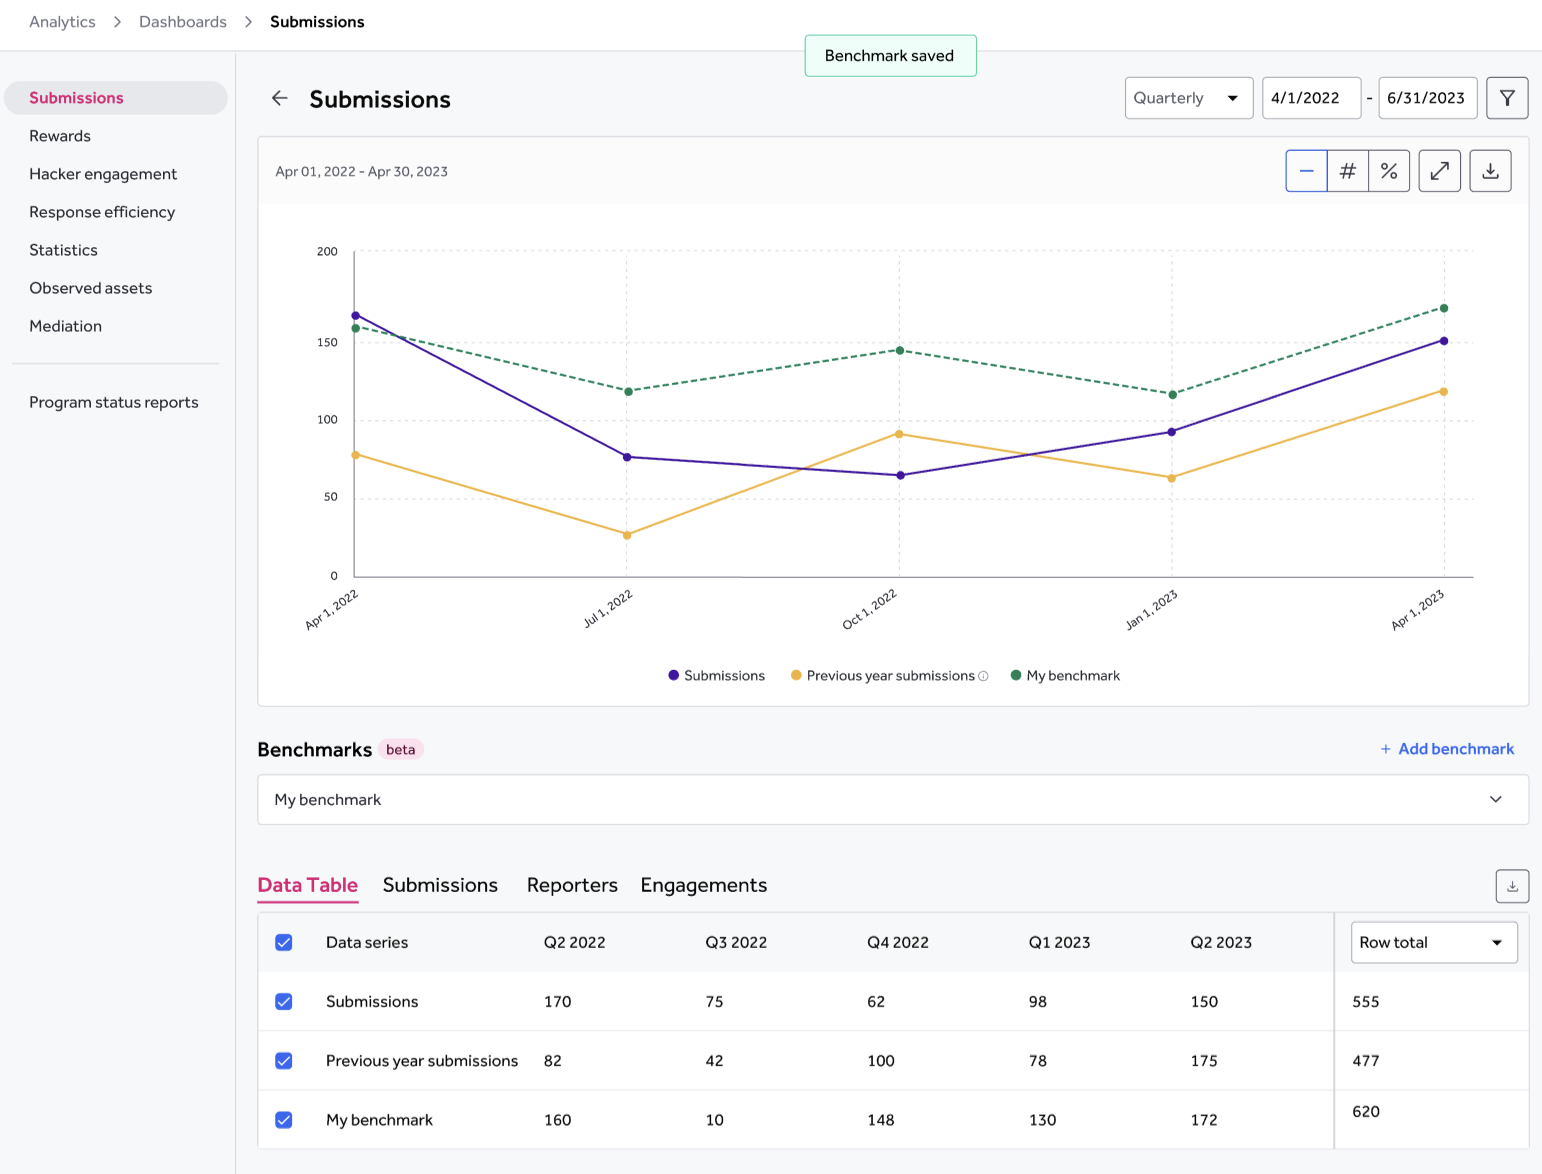
Submissions
The Submissions Chart compares the number of reports your program receives over time. Previous year comparisons enable you to measure growth, identify emerging threats, and adjust focus areas as needed. Tracking submission trends also helps you stay ahead of potential risks while ensuring your program evolves alongside the wider HackerOne platform trends.
Time to First Response (Response Efficiency)
Hackers are more likely to engage with programs that respond promptly, as faster response times lead to higher engagement and satisfaction. The Time to First Response chart measures how quickly your team addresses reported vulnerabilities on the HackerOne platform.
By incorporating benchmarks into these metrics, customers gain a comprehensive view of their program’s performance, showcasing its efficiency and identifying opportunities for improvement. Analyzing response times that fall short of your targets allows you to pinpoint areas for process enhancement, ultimately boosting efficiency and attracting more skilled hackers.

Bounty Table
A well-structured bounty table is essential for attracting and retaining top ethical hackers. Programs that offer competitive rewards typically experience higher levels of participation and engagement. The Bounty Table chart offers insights into how your rewards compare with industry standards.
In fact, 30% of customers who observe a year-over-year increase in hacker engagement have updated their bounty tables within the last year. That’s why reviewing this chart helps teams assess if they’re offering the right level of incentives to maintain and grow hacker participation.

Enterprise-exclusive Features
Enterprise customers gain access to advanced benchmarking capabilities with enhanced customization options, getting deeper and more targeted insights tailored to specific business needs:
- Advanced filtering and chart creation: Enterprise customers can create custom charts and apply filters, such as benchmarking against companies in their industry segment or targeting a vertical they want to enter. These benchmark filters can be further tailored to focus on:
- Industry
- Company size
- Report submission severity
- Performance percentile
- Public vs. private programs
- Custom benchmarks: Enterprise customers can further customize benchmarks on the following charts:
- Submissions
- Response Efficiency
- Bounty Table

Exporting Data and Insights
Each chart allows you to download as CSV, PDF, or PNG image files using the kabob menu (three vertical dots).

Why HackerOne Benchmark Stands Out
HackerOne Benchmarks leverage the largest vulnerability dataset in the industry, providing deep, customizable insights. Customers can compare against industry peers and trends specific to their segment, offering more than surface-level comparisons.
While other platforms offer basic benchmarking, HackerOne’s tools provide greater flexibility, enabling enterprise customers to create custom cohorts based on industry, peer groups, or performance brackets. Whether focused on response times or resolution efficiency, our tools help you track the metrics that matter most.
Get Started Today
Ready to understand your program’s standing within the industry and track your progress over time? Take control of your security program’s performance — check the product documentation pages here.
Connect with our experts or explore the HackerOne Platform to see how you can use your HackerOne program data to make strategic improvements and achieve stronger security outcomes.