- Modeling the Relationships Behind Fraud
- Linkage Signals That Strengthen the Network View
- Entity Resolution Without Overstating Certainty
- Detection Methods and Their Investigative Value
- Temporal Analysis for Changing Fraud Patterns
- When Risk Travels Through the Graph
- Evaluating Detection Quality
- How Adversarial Behavior Changes the Graph
- From Graph Model to Production System
- Responsible Use of Linkage Data
- Practical Conclusion

Fraud rings do not need any single account to generate an obviously anomalous risk profile. Coordinated activity can be distributed across multiple low-activity accounts, helping keep each one below the thresholds that conventional account-level controls are designed to detect.
From a network perspective, financial fraud can look very different from the isolated account events that conventional controls detect. It is most often perpetrated by networks of co-offenders, ranging from highly structured groups to looser forms of collaboration (INTERPOL Financial Fraud assessment, 2024). The detection problem, then, is not always a lack of suspicious activity, but where that activity becomes visible.
This article examines how linkage analysis can link activity across accounts and infrastructure to reveal coordinated patterns that individual risk scoring may miss, while also addressing the uncertainty and false positives that accompany relational detection.
This analysis is written for fraud and risk engineers, trust-and-safety teams, and security architects who design or evaluate detection systems at scale.
This article proposes the Evidence-to-Action Linkage Pipeline: observation → probabilistic entity resolution → reliability, uniqueness, recency, and corroboration weighting → cluster inference → reversible action. It is a conceptual design framework, not a calibrated or empirically validated model. A synthetic example shows how it works in practice.
| Stage | Input | Output | Primary failure mode | Safeguard |
| Observation | Raw account, device, network, and payment events | Structured observation records (nodes/edges) | Incomplete or noisy raw signals | Multi-source capture and validation |
| Probabilistic entity resolution | Observation records | Weighted candidate identity links | Overconfident matching on noisy identifiers | Confidence scoring with reviewable thresholds |
| Reliability, uniqueness, recency, and corroboration weighting | Candidate links | Weighted graph edges | Stale or non-unique identifiers inflating risk | Time-decay, uniqueness discounting, corroboration requirement |
| Cluster inference | Weighted graph | Candidate cluster(s) | Fragmentation or contamination of clusters | Cluster-level evaluation metrics, threshold tuning |
| Reversible action | Candidate cluster with confidence | Proportionate response (friction, review, escalation) | Irreversible action on uncertain evidence | Human review gate, reversible-by-default policy |
Consider five newly created accounts, A1–A5, each individually unremarkable. During a 24-hour signup burst, A1–A3 use device D, while A3–A5 present payment fragment P; A3 bridges the two groups. Fragment P receives lower uniqueness weight because unrelated cardholders can share it. A historical IP association last observed six months earlier is retained but strongly time-decayed.
The relationship graph therefore forms one candidate cluster, while probabilistic entity resolution preserves uncertainty rather than declaring one common identity. Because no account independently crosses an enforcement threshold, the response is step-up verification and analyst review, not suspension. This example is illustrative, not an observed or validated result.
Modeling the Relationships Behind Fraud
Account-level data becomes more useful for fraud-ring detection when it is placed inside a wider relational model. The account remains important, but it is no longer the only entity being tracked. Devices, IP addresses, sessions, phone numbers, email domains, and payment instruments can be represented alongside it as separate nodes.
Observed activity then connects those nodes. Edges can preserve information about the type of relationship being observed, while temporal information can be retained so the system knows when that relationship occurred. Heterogeneous graphs allow multiple node and edge types to coexist, making it possible to represent different financial entities and the relationships between them within the same network (Majumder et al., 2025).
This gives later analysis a richer unit of evidence. Instead of asking only what an account did, the system can examine where that activity sits within a network of related entities and events.
Linkage Signals That Strengthen the Network View
Once relationships are visible, the next task is deciding which ones actually change the risk picture. Device linkage may simply reflect legitimate reuse, but its meaning changes when the same accounts also reuse infrastructure, repeat identifiers, or act in close temporal proximity.
Behavioral and device graphs can surface similarities through logins, transaction requests, operating systems, and device IDs. These signals are especially useful when they recur across several accounts rather than appearing as isolated coincidences.
The surrounding network can add context that the identifier alone cannot provide. Short graph paths can bring seemingly unrelated accounts closer together, while dense many-to-many patterns can expose repeated interaction with the same pool of resources. Coordination is strongest when several weak signals begin to align.
Entity Resolution Without Overstating Certainty
Finding a relationship is not the same as resolving an identity. Deterministic linkage is appropriate when records share evidence that supports a direct match. Probabilistic linkage is needed when identity has to be inferred from several incomplete or imperfect observations.
The difference affects how the resulting graph should be interpreted. Confidence weighting preserves the strength of each inference instead of flattening every relationship into a yes-or-no connection. Lower-confidence matches can still contribute useful context without carrying the authority of a verified link.
That restraint matters in fraud detection, particularly where identity fraud is part of the risk being assessed. A recycled phone number, shared device, or common IP address may connect unrelated people. If those signals are treated as definitive identity evidence, the graph can turn coincidence into apparent coordination.
Detection Methods and Their Investigative Value
Rules-based detection works well when activity matches predefined conditions, while individual-entity risk scoring evaluates features attached to an account or event. Linkage analysis complements both by examining relationships between entities. Within that relational layer, different graph analytics techniques serve different purposes.
| Method | What it contributes | Interpretability | Complexity | Data requirements |
| Connected components | Finds groups connected through observed relationships | High | Low | Graph structure |
| Community detection | Identifies densely connected groups within a larger network | High to moderate | Low to moderate | Graph structure |
| Centrality | Highlights structurally important or influential nodes | High | Low to moderate | Graph structure |
| Label propagation | Extends known labels or scores through network relationships | Moderate | Moderate | Graph structure + seed labels |
| Graph embeddings | Learns numerical representations of structural relationships | Moderate to low | Moderate to high | Graph structure + training objective |
| Graph neural networks (GNNs) | Learns jointly from graph relationships and entity features | Lower | High | Graph structure + features, usually labels/training data |
A relatively transparent structural method may be sufficient when the goal is to surface suspicious clusters for investigation. More data-intensive learned methods become useful when the detection problem depends on patterns that topology alone cannot capture.
Temporal Analysis for Changing Fraud Patterns
A graph can become misleading if every connection is treated as equally current. A shared device observed yesterday is not necessarily equivalent to one seen far in the past, especially as accounts and infrastructure continue to change.
Edge timing helps distinguish recent activity from historical association. Time-decay functions reduce the weight of older interactions, while dynamic representations can adapt as new nodes and edges appear (Cheng et al., 2025).
Timing also helps identify bursts of activity. A cluster of related events within a narrow time window may indicate stronger coordination than the same activity spread across weeks or months. Static graphs can flatten these differences, preserving stale links and potentially overstating risk.
When Risk Travels Through the Graph
Risk propagation can extend an investigation beyond the entity that first triggered concern. The challenge is deciding how much suspicion should travel with each connection. Fraud graphs can contain direct relationships between fraudulent and benign entities, so proximity alone is not evidence of common intent (Xu et al., 2024).
To reduce guilt by association, a system can:
- Retain confidence scores on propagated risk
- Distinguish direct from indirect relationships
- Route consequential decisions through human review
These safeguards keep relational risk in proportion to the strength of the underlying evidence. The graph can strengthen an investigation, but it should not replace the evidence needed to justify an action against an individual entity.
Evaluating Detection Quality
A fraud detector should be evaluated against the decision it is expected to support. Class imbalance reduces the value of relying on accuracy alone, since a system can perform well numerically without detecting enough of the minority fraud class. Precision, recall, and false-positive rate provide a more useful picture of the resulting alert quality and coverage.
Graph-based linkage analysis introduces a second question about what exactly is being scored. GNN-based analysis can operate at different levels, with predictions concerning individual nodes, relationships between entities, or properties of the wider graph.
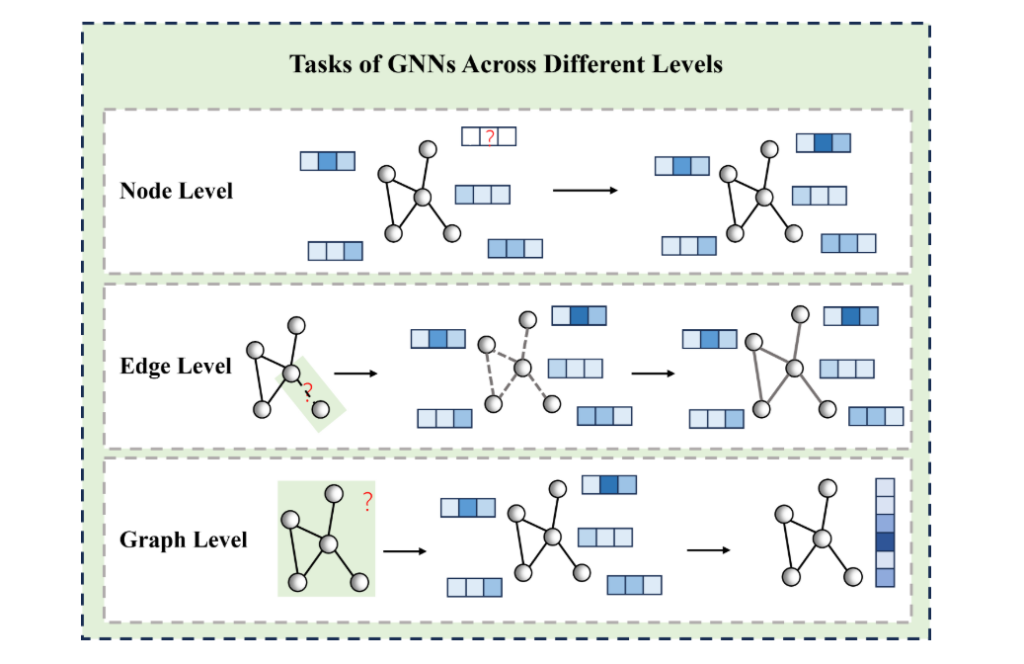
That distinction matters when defining success. Entity-level metrics can measure how well suspicious accounts are classified, but fraud-ring detection may also need to assess whether related entities are surfaced together in a form that supports investigation.
At cluster level, evaluate cluster precision and recall, contamination (benign entities incorrectly absorbed), fragmentation (one ring split across clusters), precision@k or investigation yield, and analyst workload. Use time-based validation with only evidence available at the original decision point, and evaluate delayed labels after a fixed maturity window.
How Adversarial Behavior Changes the Graph
Adversarial adaptation changes the evidentiary value of a graph before it changes the underlying fraud operation. A relationship that once looked highly stable can become temporary once offenders realize that repeated infrastructure is exposing coordination.
Device rotation weakens long-lived hardware links, while residential proxies make IP reuse less straightforward to interpret. Synthetic identities complicate the relationship between an account and a real-world actor. Intermediary accounts can also place apparently ordinary entities between suspicious nodes.
The practical consequence is that graph features should age and be re-evaluated. Persistent risk cannot be inferred simply because a relationship was once informative, especially when attackers have incentives to alter the network around it.
From Graph Model to Production System
A graph can surface a suspicious relationship, but production systems still have to decide how quickly that information needs to become actionable. Streaming computation suits signals that can materially change a live decision, whereas broader graph analysis may be better calculated periodically when it requires more expensive traversal or model inference.
That choice affects feature freshness and latency. A result based on an outdated graph may be technically correct yet operationally irrelevant by the time it reaches the decision layer.
For cybersecurity analytics teams, the final output also has to support investigation. Analysts need to see which relationships contributed to the alert and how strongly they influenced it. When evidence is indirect or uncertain, human review provides an important check before action is taken.
Responsible Use of Linkage Data
A production graph can reveal connections that would never appear in an account-level view. That broader visibility increases the need to define what information the system genuinely needs and how far its use should extend. Keeping that scope controlled requires explicit boundaries:
- Minimizing the data entering the graph
- Defining when stored links should expire
- Restricting access to sensitive relationships
- Making consequential decisions auditable
- Excluding protected or overly invasive attributes
These controls make privacy and fairness part of the system design rather than a later compliance check. They also help keep what gets modeled, retained, and used proportionate to the fraud risk being investigated.
Practical Conclusion
Linkage analysis can reveal suspicious relationships, but those relationships should gain weight only when other evidence supports them. Behavioral analytics can describe what an account is doing, rules can capture known forms of abuse, and statistical or machine-learning models can estimate risk across larger feature spaces. Linkage signals can then show whether signs of account abuse are isolated or part of a connected pattern.
The Evidence-to-Action Linkage Pipeline described earlier formalizes this restraint: risk only advances from observation to action once resolution, weighting, and clustering support it, and even then through a reversible response.
Human investigation completes the system by handling cases that remain uncertain. This architecture treats graph analysis as part of an evidence chain and can improve coordinated abuse detection without placing too much weight on proximity, shared identifiers, or model complexity.