- Introduction
- Background and the threat landscape
- Design philosophy: why not Fail2Ban?
- Detection strategy and implementation strategy
- Threshold logic and tuning
- Ingesting Traefik access logs
- Building a custom ingest pipeline
- Automated response via Cloudflare workflow
- Prerequisites and token scope
- Workflow configuration and triggers
- Constants and authentication
- Step 1: Retrieving the current blocklist
- Step 2: Updating or creating the firewall rule
- Step 3: Acknowledging the alert
- Step 4: Attaching the Workflow to the Rule
- Note on WAF limits
- Testing and Validation
- Expanding the defense
- Conclusion

Introduction
Self-hosted services exposed through a reverse proxy inevitably attract automated scanners probing for misconfigurations, admin panels, and vulnerable endpoints. In this article, I show how to turn routine Traefik access logs into an active defensive control using Elastic Security and Cloudflare.
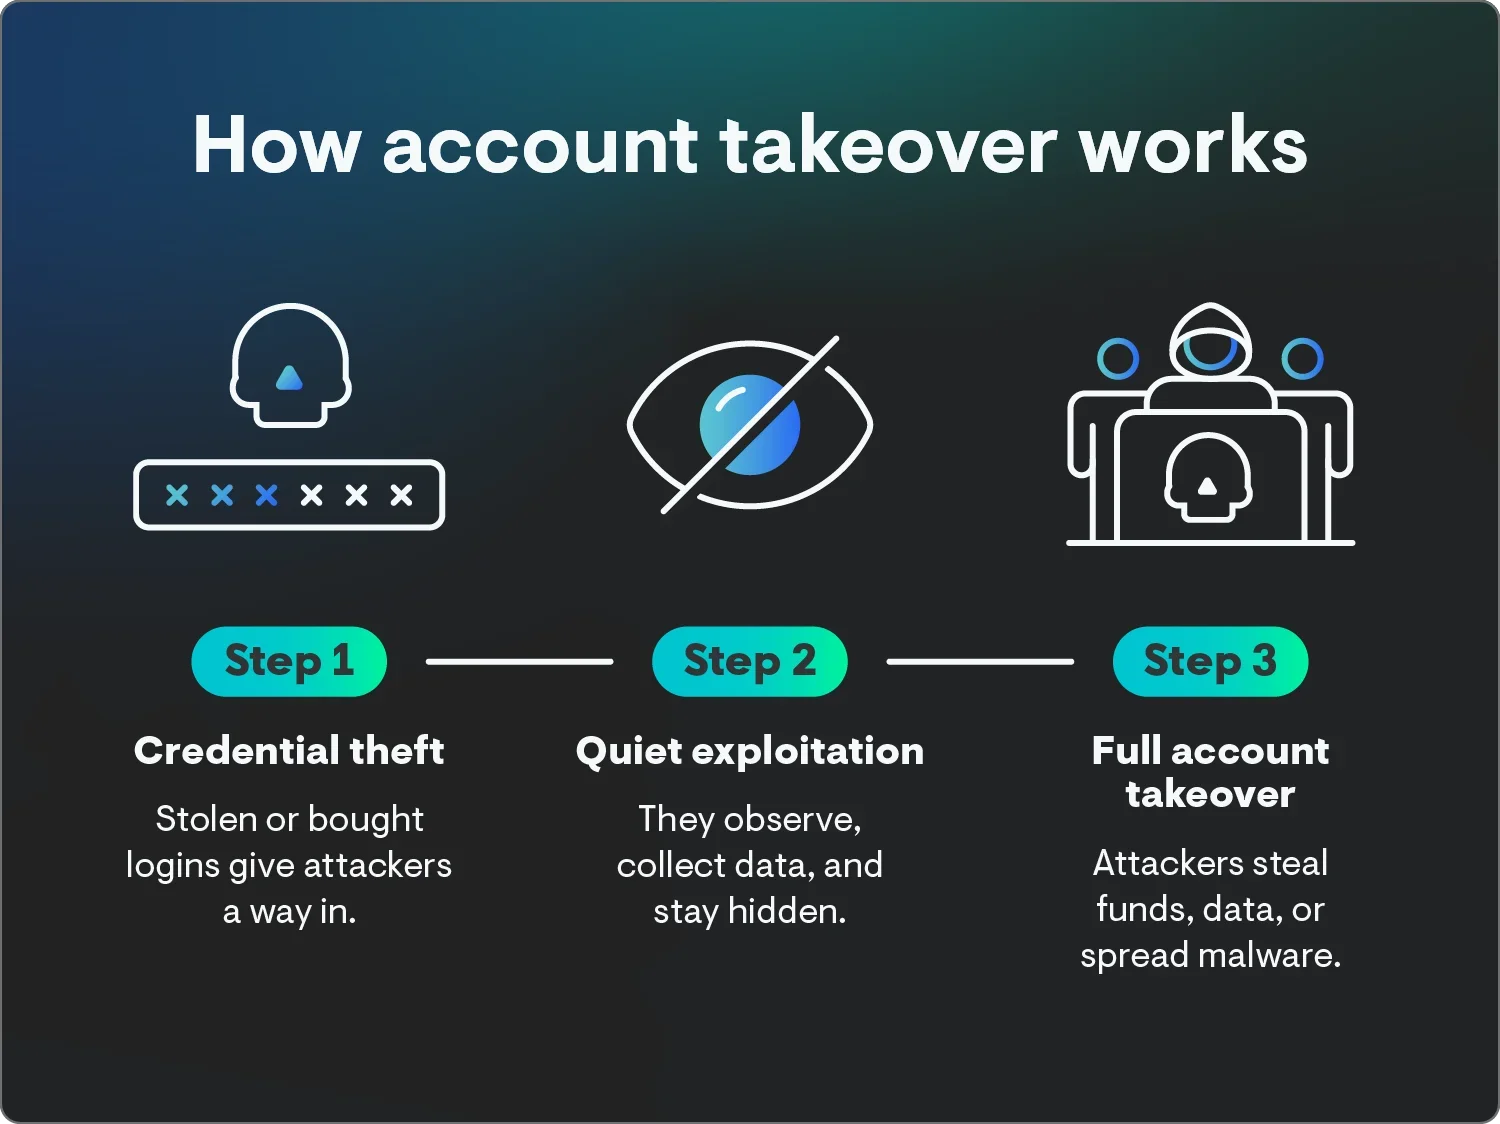
I use an out-of-the-box ES|QL detection rule to identify web server discovery and fuzzing behavior. When suspicious probing patterns are detected, an automated workflow immediately blocks the offending source IP at the edge via the Cloudflare API. The best part about this setup is that it scales effortlessly. By building this response plumbing once for fuzzing detection, I can attach the exact same block action to any other Elastic rule such as those catching SQL injections or file inclusion attempts. This transforms a basic logging pipeline into a highly adaptable perimeter defense.
Background and the threat landscape
My homelab setup utilizes Proxmox VE for containers and VMs. I use a Traefik reverse proxy, secured with Authelia for authentication, to allow external access without a VPN. Cloudflare, with proxy enabled, manages DNS.
For those less familiar with this specific stack, Traefik acts as the network’s front door. When a web request arrives via Cloudflare, Traefik dynamically routes the traffic to the correct internal container while managing SSL certificates to keep the connections encrypted. However, before any traffic actually reaches those backend applications, it gets intercepted by Authelia. By leveraging Traefik’s forward authentication feature, Authelia enforces Single Sign-On and Multi-Factor Authentication across the board. This means automated scanners and attackers cannot even reach the login screens of my internal services without passing through that initial secure portal.
To maintain visibility and security, I ingest these Traefik access logs into Elastic using the official integration. During routine monitoring, I’ve observed numerous HTTP 404 response codes originating from the same source IP addresses in these logs.
This pattern suggests potential web server probing or fuzzing traffic targeting vulnerabilities in applications that are not actually in use on my network. Examples of these targeted paths include /wp-includes/mani., /wp-content/plugins/all-in-one-wp-security-and-firewall/templates.php, /archive.php, and /wp-admin/includes/header.php.
Design philosophy: why not Fail2Ban?
A common question in the homelab community is why not simply use local tools like Fail2Ban or CrowdSec directly on the Traefik server. While those are excellent tools, orchestrating the response through Elastic Security and pushing the block to Cloudflare provides two major advantages. Dropping malicious traffic at the Cloudflare edge saves local bandwidth and keeps scanners off the home network entirely. Plus, orchestrating the response through Elastic gives us a single pane of glass for all security monitoring.
Detection strategy and implementation strategy
To effectively identify malicious reconnaissance, our strategy relies on analyzing the frequency of HTTP response codes at the proxy level. Specifically, we are looking for a high volume of 404 (Not Found) errors generated by a single source IP within a short time window, a classic indicator of directory fuzzing or vulnerability scanning.
While Elastic Security provides robust, out-of-the-box detection rules for this exact scenario, these rules require properly normalized ECS (Elastic Common Schema) data to function correctly. Detecting and mitigating these scans therefore requires a coordinated flow. To get this working, we need to ingest the Traefik logs, patch in the missing host.name field using a custom pipeline, and point the detection rule at our data.
Threshold logic and tuning
Our detection strategy shifts away from simple string matching, relying instead on statistical thresholds. The rule specifically monitors for denied or non-existent resources represented by HTTP 403 and 404 response codes and aggregates this activity by the originating source IP.
This behavior is governed by the final where statement in the query. By default, an alert only triggers if a source IP produces more than 500 errors across 250 distinct URI paths during the polling window. This dual-layered threshold is designed to eliminate false positives, ensuring that a single broken asset doesn’t trigger a block while still identifying automated scripts that cycle through directory wordlists.
In a smaller homelab or smaller teams environment, these defaults are often too permissive. Since legitimate external traffic has no reason to hit non-existent admin panels on my network, I adjusted the sensitivity to catch stealthier reconnaissance efforts early. I modified the logic to trigger when event_count > 100 and url_original_count_distinct > 50.
For production environments where applications naturally generate higher error volumes, you might consider increasing these values or appending an ES|QL where not clause to exclude known broken links. Finally, I use a where source.ip not in (...) filter to ensure that authorized security tools or personal vulnerability scanners are not accidentally banned by the automated workflow.
Ingesting Traefik access logs
To ingest the Traefik access logs into the cluster, I used the default integration for Traefik. The Elastic Agent collects logs from Traefik servers. This integration writes the ingested logs into the logs-traefik.access-default datastream.
Building a custom ingest pipeline
The host.name field is crucial for the detection rule I’m using, but the default Traefik integration doesn’t populate it. Therefore, a custom ingest pipeline is required to add this field. Since the Traefik integration utilizes a file stream on the Traefik server, I can copy the value from the existing agent.name field to populate host.name.
I specifically use the logs-traefik.access@custom pipeline instead of modifying the main one. Elastic integrations are designed to automatically pick up and run these @custom pipelines right at the end of their processing flow. More importantly, default pipelines get completely overwritten whenever I upgrade an integration. Stashing my logic in the custom pipeline ensures that my field mappings actually survive the next update. The necessary API call to create this pipeline can be executed in the Dev Tools console:
PUT _ingest/pipeline/logs-traefik.access@custom
{
  "description": "copy the agent.name field to the host.name field",
  "processors": [
    {
      "set": {
        "field": "host.name",
        "value": "{{{agent.name}}}",
        "override": false,
        "ignore_empty_value": true,
        "ignore_failure": true
      }
    }
  ]
}
Automated response via Cloudflare workflow
To move from detection to active defense, we implement a workflow that bridges the gap between our Elastic alerts and the Cloudflare edge. The logic is designed to be efficient: rather than creating a new firewall rule for every single alert, which would quickly hit Cloudflare’s rule limits, the workflow first retrieves the existing blocklist. It then dynamically appends the new offending source IP to that list before pushing the update back to the Cloudflare API. Once the edge is secured, the workflow finishes by acknowledging the alert in Elastic, effectively closing the loop on the incident.
Prerequisites and token scope
This process requires both an API key and the Zone ID for the Cloudflare configuration. The API token must possess “Zone WAF edit” privileges to enable the creation of the rule. When generating this token in the Cloudflare dashboard, use the “Create Custom Token” option and set the permissions strictly to Zone -> Zone WAF -> Edit.
Once the workflow is configured, it must be assigned as an action to the “Web Server Discovery or Fuzzing Activity” detection rule.
With the prerequisites in place, let’s walk through how we build the workflow step-by-step.
Workflow configuration and triggers
First, we define the basic metadata. This workflow blocks the IP addresses found in the alerts of the Web Server Discovery or Fuzzing Activity. The workflow is enabled and has a timeout of 30 seconds for the API request. In this case, it’s based on an alert, so it runs automatically when a security alert is triggered.
# =========================================================================
# Workflow: Block IP at Cloudflare test
# Category: security/response
# =========================================================================
version: '1'
name: Block IP at Cloudflare
enabled: true

triggers:
  - type: alert
Constants and authentication
This section holds the variables for authentication. Remember to substitute the placeholder strings with your actual API token and Zone ID.
consts:
  cloudflare_api: ""
  cloudflare_zone: ""
Step 1: Retrieving the current blocklist
The sequence checks if the firewall rule already exists. The workflow makes an HTTP GET request to retrieve the existing IP block rule.
steps:
  - name: cloudflare_current_block
    type: http
    with:
      url: "https://api.cloudflare.com/client/v4/zones/{{consts.cloudflare_zone}}/rulesets/phases/http_request_firewall_custom/entrypoint"
      headers:
        Authorization: Bearer {{consts.cloudflare_api}}
      method: GET
    on-failure:
      continue: true
Step 2: Updating or creating the firewall rule
If it exists, the rule gets appended with the IP address otherwise, the rule gets created. The workflow identifies if the “webserver scanning block” description is present. If so, it appends the new IP address to the current list of blocked IP addresses via a PUT request. If not, it falls back to creating a new rule.
 - name: cloudflare_block
    type: if
    condition: 'steps.cloudflare_current_block.output.data.result.rules[0].description == "webserver scanning block"'
    steps:
      - name: ip-block-cloudflare_add
        type: http
        with:
          url: "https://api.cloudflare.com/client/v4/zones/{{consts.cloudflare_zone}}/rulesets/phases/http_request_firewall_custom/entrypoint"
          method: PUT
          headers:
            Authorization: Bearer {{consts.cloudflare_api}}
          timeout: 30s
          body: '{ "rules": [ { "description": "webserver scanning block", "expression": "{{steps.cloudflare_current_block.output.data.result.rules[0].expression}} or (ip.src eq {{event.alerts[0].source.ip}})", "action": "block" } ]}'
    else:
      - name: ip-block-cloudflare_new
        type: http
        with:
          url: "https://api.cloudflare.com/client/v4/zones/{{consts.cloudflare_zone}}/rulesets/phases/http_request_firewall_custom/entrypoint"
          method: PUT
          headers:
            Authorization: Bearer {{consts.cloudflare_api}}
          timeout: 30s
          body: '{ "rules":[ { "description": "webserver scanning block", "expression": "(ip.src eq {{event.alerts[0].source.ip}})", "action": "block" } ]}'
    on-failure:
      continue: true
Step 3: Acknowledging the alert
Then the alert gets acknowledged. This step uses the kibana.SetAlertsStatus action to automatically close out the alert in Elastic Security.
  - name: update_alert_status
    type: kibana.SetAlertsStatus
    with:
      status: "acknowledged"
      signal_ids: ["{{event.alerts[0]._id}}"]
Step 4: Attaching the Workflow to the Rule
With the workflow fully built, the final step is to actually attach it to the detection rule so it fires automatically. In the Elastic Security rule settings for the “Web Server Discovery or Fuzzing Activity” rule, I navigate to the Rule actions tab and add a new action. From the connector dropdown, I simply select the Cloudflare workflow I just created.
Note on WAF limits
Because this workflow concatenates IP addresses using an or statement (or (ip.src eq ), be mindful that Cloudflare has a character limit for custom WAF expressions (typically 4096 characters on standard tiers). In highly targeted environments, this string can eventually hit the limit. For homelabs and small teams, occasionally clearing out this WAF rule manually serves as a healthy reset.
Testing and Validation
To verify the pipeline is working end-to-end, we can generate some noise with a standard fuzzing tool. You can simulate a scanning attack against your own homelab using a fuzzing tool like ffuf or gobuster.
Run a quick scan against a non-existent directory on your public-facing Traefik domain:
ffuf -u https://your-domain.com/FUZZ -w /path/to/wordlist.txtOnce the simulation is running, we can observe the automated defense chain in action. The 404 errors appear almost immediately in the logs-traefik.access-default datastream. Within the polling interval, the ES|QL rule identifies the pattern and generates a new alert in the Elastic Security Alerts page. From there, the workflow takes over: it shifts the alert status to “acknowledged” and pushes the IP block to our Cloudflare WAF rule, effectively neutralizing the scanner at the edge before it can continue its reconnaissance.
You can confirm the block was successful by checking your Cloudflare Dashboard under Security -> WAF -> Custom rules. (Note: Be sure to remove your IP from the Cloudflare rule afterwards so you don’t lock yourself out!)
Expanding the defense
The beauty of this setup is that our Cloudflare workflow isn’t limited to just fuzzing detection. Once the automation is built, we can attach it to any Elastic rule that flags suspicious proxy traffic. For instance, we can tie this exact same response action to out-of-the-box rules targeting specific application exploits, like Web Server Local File Inclusion Activity, Web Server Potential Remote File Inclusion Activity to drop the attacker immediately. It also pairs perfectly with Potential Spike in Web Server Error Logs and Unusual Web User Agent to catch misconfigured scrapers and broader network noise. We build the plumbing once, and suddenly the whole perimeter gets smarter.
Conclusion
Wiring Traefik and Cloudflare into Elastic Security is a great way to turn basic access logs into an active defense. Homelab environments are constantly bombarded by automated scanners looking for low-hanging fruit. This automated workflow not only blocks attackers at the edge but also reduces alert fatigue by acknowledging the incidents automatically. It is a practical example of how security orchestration and response can save time while significantly improving your security posture.