Peer benchmarks, exposure timing, and threat actor insight, orchestrated by agentic AI to turn TruRisk into decisions you can defend.
When we first outlined the idea of TruLens at ROCon Houston in 2025, it was a vision, one that imagined a future where a security leader could see their environment the way an adversary does: in context, in motion, and in comparison, with true peers. We described a capability that would bring adversary intelligence, industry-specific context, and peer comparison into a single platform backed by 120+ analysts in the Qualys Threat Research Unit (TRU). The core detection capabilities were already there: 99%+ coverage of the CISA KEV catalog, and the ability to elevate vulnerability severity an average of 40 days before a CVE makes it onto the KEV list. It was a blueprint for how threat intelligence and cyber‑risk management could finally converge.
Today, we are moving from concept to execution. We are delivering the reality of that vision as part of Qualys Enterprise TruRisk Management (ETM). This is a fundamental shift in how security leaders quantify and mitigate risk. We are moving beyond the theoretical “what should I patch” to concrete, business-aligned answers: how fast you are patching compared to exact peers, whether you beat the attacker to a working exploit, and which specific threat groups are targeting your unique footprint.
Know Where You Stand
The hardest slide in any board presentation is the peer comparison. Industry reports are too broad. Analyst benchmarks are stale by the time they are published. Self-reported metrics lack credibility. TruLens solves this by constructing your peer cohort across three precise dimensions: Geography, Industry, and Size (GIS). This ensures your benchmarks are grounded in reality. A 500-person regional bank in the Midwest is benchmarked against exact operational peers, not massive global financial institutions. Two benchmarks are available today.
- MTTR Peer Comparison ranks your remediation speed against your cohort by percentile. You can track MTTR specifically against CISA KEV vulnerabilities, against critical vulnerabilities in your environment, or across the full vulnerability population. The goal is measuring speed where it matters, not as a blended average that buries the gaps you need to see.
- Ransomware Exposure Benchmarking shows your exposure to ransomware-linked CVEs alongside your peers’ remediation rates for those same vulnerabilities. When the majority of your cohort has already patched, and your organization has not, that fact communicates urgency in a way no severity score ever could.
Quantifying the Race Against the Attacker by Turning Exposure Timing into a Measurable Metric
Every security team has lived through the same post-mortem. A high-profile CVE drops. The patching cycle starts. Days later, confirmed exploitation appears in threat intelligence. The question that always follows is: were we remediated before the attacker had a working exploit, or was there a window where we were exposed, and they were armed? Until now, answering that question meant stitching together patch timelines, threat intel feeds, and manual spreadsheet work after the fact.
TruLens replaces that work with three exposure metrics calculated automatically for every applicable CVE:
- WOW (Window of Weaponization): This measures the attacker’s speed. It calculates the calendar days between a CVE’s publication and the first confirmed exploit in the wild. If WOW is negative, the exploit existed before publication. That is a zero-day, and TruLens surfaces it immediately without normalizing the risk away.
- AWE (Average Window of Exposure): This measures the defender’s speed. It calculates the average days between a CVE’s publication and confirmed remediation across your assets. If remediation is in progress, AWE stays open as a live, growing counter.
- REG (Residual Exposure Gap): This is the definitive metric. REG equals AWE minus WOW. It answers the critical question: after the attacker had a working exploit, exactly how many days did your organization remain exposed?
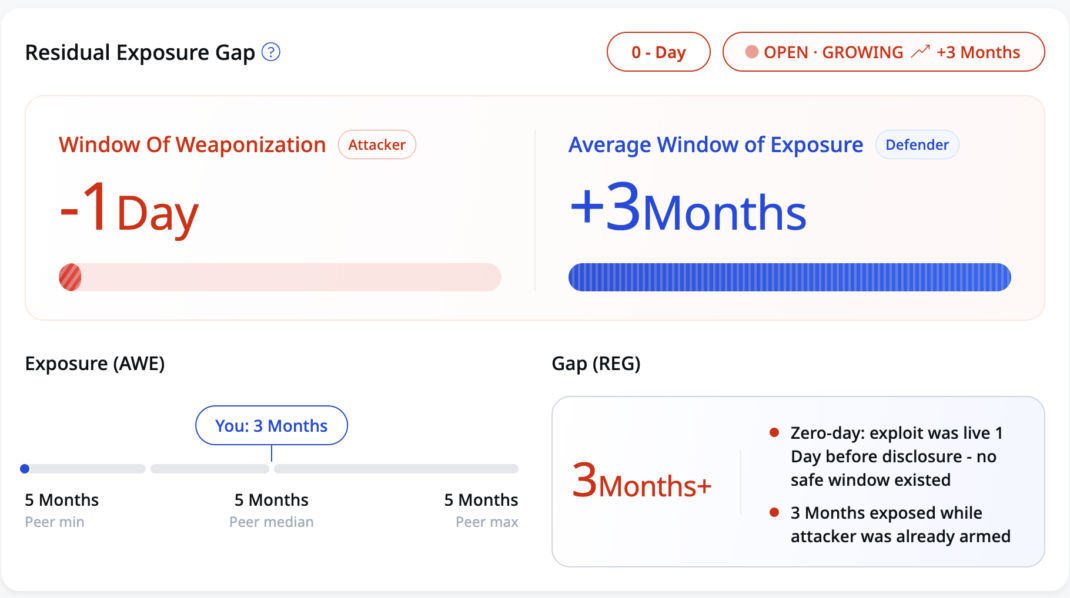
Think of REG as the overlap between attacker opportunity and defender inaction. A positive REG means there was a measurable window where attackers could have walked through an open door; the larger the number, the more time they had. A negative REG means your team closed the door before a working exploit was available. REG turns a vague sense of “we should patch faster” into a concrete, per-CVE metric that both operations and leadership can act on.
REG also works as a zero-day indicator. When WOW goes negative, REG widens to include the full pre-disclosure exposure window, quantifying how much additional risk that zero-day condition created in your environment. When WOW data is not available for a given CVE, TruLens displays AWE on its own and labels WOW as unknown rather than implying “no risk.”
Threat Actor Attribution: Moving From “What” to “Who”
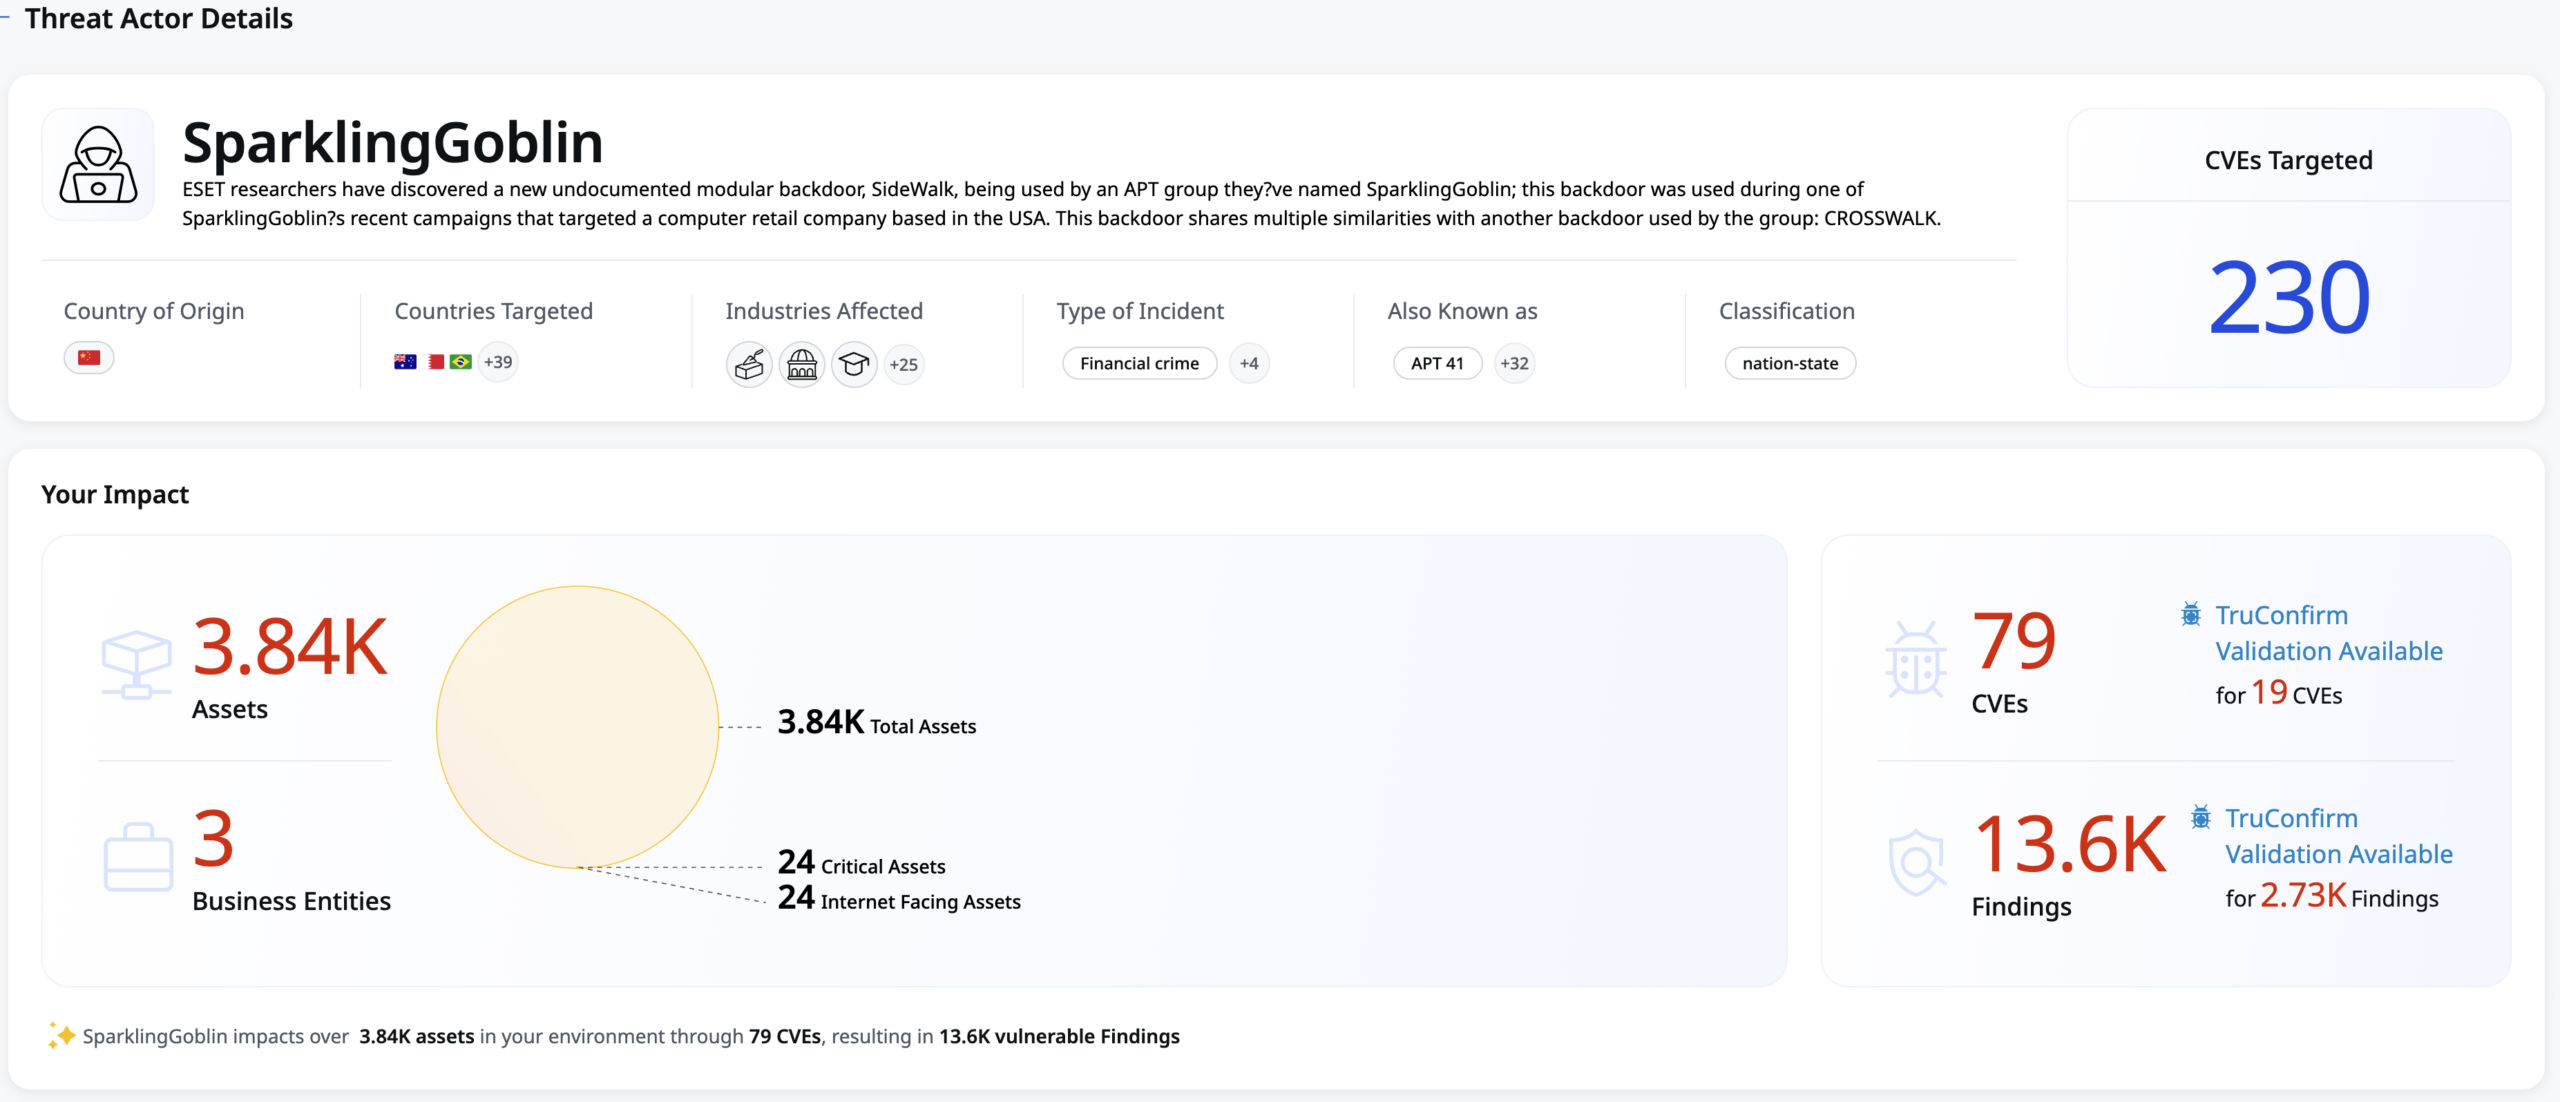
Prioritization changes completely when you know who is on the other side of the screen. It alters executive communication, incident response planning, and resource allocation. TruLens now maps threat actor attribution to every CVE in your environment. This runs on the Qualys CTDB (Cloud Threat Database), which covers nearly 700 threat actor groups, more than 6,800 actor-to-CVE relationships across 39 industry buckets, with full alias normalization and country attribution. This intelligence surfaces in four distinct ways:
- CVE-Level Attribution: See exactly which actors exploit a CVE, when they started, and if they target your specific industry.
- Industry-Ranked Adversaries: Threat actors are stack-ranked by relevance to your GIS peer cohort.
- Campaign Context: When a CVE is part of a broader campaign like Cl0p or Scattered Spider, TruLens links it to the narrative so you understand the “why” behind an activity spike.
- Geopolitical Mapping: Origin and target visualizations allow you to correlate regional tensions with threat activity against your environment in real time.
The result is a shift from “How severe is this CVE?” to “Which adversaries are using this CVE against organizations like ours?” That is a more direct and useful conversation for risk owners.
From Intelligence to Proof: TruLens, Agent Val, and TruConfirm
Threat intelligence that stops at a dashboard is only half the job. The other half is proving the threat is real in your environment and neutralizing it. TruLens was always intended to feed a larger risk operations workflow inside ETM. With Agent Val (powered by Agentic AI) and TruConfirm, that workflow becomes a closed loop, moving from intelligence to proof to remediation in a single operating model.
- TruLens identifies the critical priorities based on exposure metrics, threat actor context, and business impact.
- Agent Val decides what to validate next. It autonomously selects the highest-priority exposures from TruLens without requiring manual triage.
- TruConfirm proves it. It executes production-safe exploit validation on live assets using cryptographic proof-of-execution. When exploitation is confirmed, ETM amplifies the TruRisk score and triggers remediation actions. When it fails, you have documented proof that your compensating controls work.
The full sequence runs continuously: TruLens identifies → Agent Val selects → TruConfirm validates → ETM remediates → TruRisk updates → TruLens reflects the improved posture. This is CTEM operationalized in one platform: no CSV handoffs, no swivel-chair between tools, and no gap between the team that identifies risk and the team that proves and closes it.
Agentic AI in the Architecture, Not Added On
The agentic layer in TruLens is built into how the platform works, not a feature layered on top.
- Natural language queries allow analysts to ask complex questions directly in ETM, retrieving structured results from 20+ specialized intelligence tools instantly.
- Agent Val turns exploit validation from a periodic exercise into a continuous autonomous process, selecting targets from TruLens intelligence and running TruConfirm without waiting for manual review.
- Additionally, QVSS standardizes Qualys threat intelligence onto a 0 to 10 scale, translating deep QDS signals (KEV status, exploit maturity, EPSS) into one unified language across security and IT.
Threat intelligence flows into orchestration, orchestration produces proof, and proof drives remediation. The agents handle speed while your team keeps control of strategy and policy.
The Bottom Line
The outcome is simple: TruLens gives security and risk teams the answers they have been missing. They can see how their remediation speed compares to true peers, quantify exactly how long attackers had a viable window to act, and understand which threat groups are actually investing in exploiting their environment. Because TruLens is wired into Agent Val, TruConfirm, and ETM, those insights do not sit on a dashboard. They drive continuous validation, prioritized remediation, and measurable TruRisk improvement. That is what TruLens delivers today: not more data, but answers your board, your operations teams, and your regulators can all stand behind.
Start a free 30‑day trial of Qualys Enterprise TruRisk Management and see TruLens in action.
Contributors
- Anurag Pal, Principal Product Manager, Qualys