Not all managed detection and response (MDR) solutions are equal. Finding the differences between vendors can be quite hard, and then understanding how those differences impact your business can be even harder. For instance, you may come across an MDR provider whose pricing is based on how much data you ingest rather than the number of assets you protect.
Ingestion-based solutions have the potential to be more cost effective if you’re selective about what security telemetry you ingest – but then who analyzes the impact of the logs you’re leaving out until they’re needed?
Or, consider an MDR solution that’s more EDR with just a few additional log sources. For some organizations this is a perfectly optimal fit. But, how often are logging blind spots reviewed and accepted as a risk? In my experience, very rarely.
I like to spend time educating customers on the importance of defense in depth, and partners on how to clearly demonstrate its importance when it comes to catching and stopping attacks.
The Swiss Cheese model
One of my favorite ways of explaining defense in depth is the “Swiss Cheese model.”
Figure 1: The Swiss Cheese model
⠀
It’s a risk model successfully used across industries like aviation safety, engineering and other domains. Its guiding principle is that a single safeguard is not fool-proof when it comes to mitigating accidents, and that true resilience is dependent upon multiple layers of monitoring and control.
The great thing about this model is that it translates really well when it comes to security operations and the technologies (SIEM) and services (MDR) that underpin it. In the case of these solutions, each slice of “cheese” is a combination of log source and detection rules across multiple attack surface domains – think endpoint, identity, cloud, or network – each reinforced by multiple log sources and detection rules that ladder up to those domains.
The logs and detection rules working in combination is what represents the whole slice of cheese.
For example, let’s say you have an agent capturing activity on all of your servers and endpoints. But, an attacker has managed to steal some VPN credentials to log in to your corporate environment like a normal user. There is no agent on the attacker’s machine, only on corporate users’ machines.
Their next step is to enumerate the environment, which can be a combination of passive monitoring and active scanning. Their task? Finding that next stepping stone so they can ultimately make their way to gaining domain admin credentials or exfiltrating data from the environment as an example.
There are lots of activities the attacker can implement to achieve this without alerting any agents.. But, what if we have some log sources monitoring active directory, firewall/VPN access, and even a network-based sensor monitoring traffic going in and out of the firewall? It means we can gain additional visibility, capturing this malicious activity before it escalates.
Other methods of initial access – like phishing – can also be captured through adding log sources for email solutions and any other email-related activities. An example could be changing email inbox rules so that an unsuspecting user can’t see all the replies to the emails the attacker is sending from their mailbox.
What are the “holes” of the cheese slice?
Not every log source is able to capture every malicious activity from an attacker, which is why we need multiple layers. The holes can be for a few reasons – visibility gaps in the log source e.g. if you only have your EDR installed on 90% of the assets that can have it installed there is a clear hole. There are also detection rule shortfalls – either a rule does not exist to alert on that activity when it occurs or perhaps the log source is limited in how it records the behavior which makes creating a detection not possible.
This the whole foundational principle of Swiss cheese theory, that we should expect an attacker to be able to circumvent a single layer
How do we know what log sources and detections we need?
For each type of asset in your environment, it’s a great idea to draw up a Threat Model. For the purposes of this blog, the below model is fairly high level. An organization-specific threat model should go more in depth, but hopefully you can get the general idea.
- Group types of assets together where it makes sense. For instance:
- Windows and Mac work stations
- Billing servers
- CRM
- Network equipment and firewalls
- Domain controllers
Think about how an attacker might attempt to use these assets either to monetize the environment (i.e. ransomware) or as a stepping stone to a more critical asset.
Think about the log sources that would contribute towards highlighting attacker activity on those assets. For instance:
As I stated, this is high-level and not exhaustive, but the idea is to think of the attacker’s actions and all of the potential log sources that could detect those actions in order to ensure you’re able to capture this activity.
Of course, this model might come under scrutiny when looking at the costs of ingesting and storing log data. Organizations then have to balance the cost of technical detections with the value they provide. In real terms, if you must choose three out of five log sources because that’s what you can afford, you should pick the three most valuable to your business.
The value should come from a combination of the number of detections they drive and the quality of those detections. For example, one log source might drive 1,000 detection types, but the detections themselves have a high benign positive ratio (say 29 in 30 are benign) on 80% of the detections, whilst another log source might drive 500 detections but have a much lower benign positive ratio of 1 in 10. This forces detection engineers to create the most optimal log-and-detection rule sets in order to optimize the cost of the SIEM.
Cheese with a complex flavor is nice, overly complex MDR pricing is not
All those calculations above sound complex, right? Much of that complexity can be made simpler with an asset-based pricing model, such as the one used by Rapid7.
The price is fixed on the number of servers and workstations, and customers can connect any number of log sources. This means when you’re modeling threats and detection of those threats, there are no cost constraints to consider for onboarding additional log sources, which would improve detection fidelity.
With that in mind, here’s a few questions I would suggest customers ask themselves to establish which solution is the right one for them:
Size: How big are you in terms of employees or number of assets?
A 5,000 employee business with a 20 person Security team is more likely to need a SIEM with unlimited ingestion than a 20 person business with one combined IT/security person.
Assets and tech stack: What types of assets are being protected and what technologies are in use?
This helps dictate whether an EDR with a few extra log sources is more suitable as the backbone of an MDR service versus One that incorporates a wide variety of telemetry sources.
Whilst the lines aren’t clear cut, these can be general areas to investigate and better understand. Other factors that also come into play are things like the type of threat actors that might target your organization. Here is an example of what it could look like worked into a threat model I spoke about.
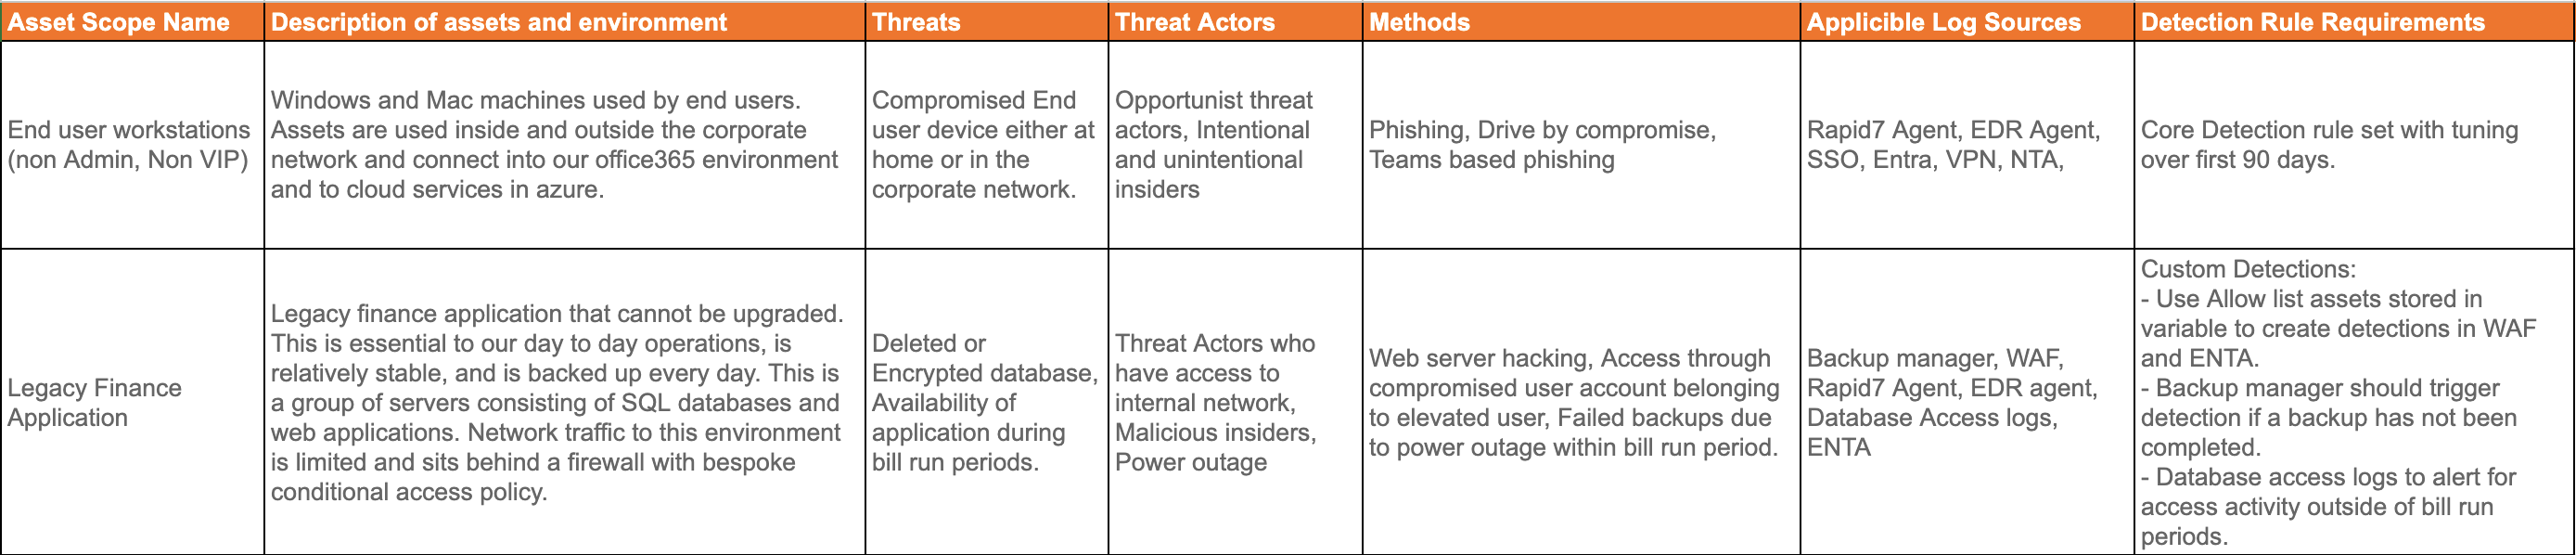
Tap to enlarge image
Comparing solutions
Attempting to compare asset-based and ingestion-based solutions can be tricky. If you try to constrain to a consistent set of log sources for the two solution types, you could be depriving your organization of the main benefit of an asset-based pricing structure: the ability to bring more log sources and detections – and therefore additional layers of protection – for the same cost. This would, of course, give you a lower cost-per-detection. Let’s take a look at some ideas that might help:
Look at cost-per-detection when fixing a cost limit.
- For example, you take the asset-based structure and solution cost, and configure an equivalent cost on an ingestion-based solution. You then look at how many log sources and detections that gets you, then calculate the cost-per-active-detection. It’s also best to model this on your own or potential customers’ environments.
Evaluate quality of detections within the model environment using the cost model constraint.
- Running the same offensive exercises in the same environment is a fair test to run, so in this instance you should set up all the log sources for each model up to your cost constraint. Keep in mind you will likely have more log sources for an asset-based model. This is still a fair test, as our key comparison metric is total cost of the solution regardless of how that solution detects the attacker.
Detection noise under normal conditions.
- This is an indication of the quality of the detection rules under normal conditions. It’s great to detect attackers in an isolated environment, but in a production network with users working, it may also introduce many benign or false positives that the same detection rules will alert on. You want your detection rules to only alert on real attacker activity.
Give detection rules a score:
- Did they detect the attack correctly?
- Do they alert on normal user activity?
- If so, how often within a 30-day window?
MDR / SIEM Solution 1 | MDR / SIEM Solution 2 | ||
Metric 1 – Solution Coverage | |||
Cost | $100,000.00 | $100,000.00 | |
Total Applicable log sources for example customer | 30 | 20 | |
Points | 30 | 30 | 0 |
Metric 1.5 – Solution Detection Value | |||
Cost | $100,000.00 | $100,000.00 | |
Total detection rules applicable to log sources | 10,000 | 7,000 | |
Cost per Detection | $10.00 | $14.29 | |
Points | 30 | 30 | 0 |
Metric 2 – Quality 1 – Offensive Testing in isolated environment | |||
Total tests conducted by offensive team | 18 | 18 | |
Total detections triggered per solution | 15 | 16 | |
% of coverage | 83% | 89% | |
Points | 30 | 0 | 30 |
Metric 3 – Quality 2 – rules triggered by normal user activity | |||
Total investigations triggered in 30 days | 100 | 130 | |
Total True Positive investigations in 30 days | 90 | 87 | |
True Positive Ratio % | 90% | 67% | |
Points | 40 | 40 | 0 |
Metric 4 – Monthly SOC operations overhead – tuning and detection rule writing (N/A for Managed) | |||
Hourly rate | $200 | $200 | |
Tuning time in hours over the last 30 days | 10 | 12 | |
Detection rule writing time in hours over the last 30 days | 6 | 8 | |
Monthly soc operations overhead in $ | $3,200.00 | $4,000.00 | |
Points | 10 | 10 | 0 |
Metric 5 – Implementation time | |||
Hourly rate | $200 | $200 | |
Time to implement solution in hours for example customer | 40 | 40 | |
Total PS cost for solution implementation | $8,000.00 | $8,000.00 | |
Points | 10 | 0 | 0 |
Total Points | 110 | 30 |
⠀
Whilst there are no absolutes, there are some good rules that can help you on the path to choosing an MDR provider that works best with and for your organization. Focusing on the assets and technologies that you want to protect, and looking at log sources and detections that support that is a great place to start.
The higher the importance and complexity of the asset, the more layers you ideally want, and having the table above to clearly define your quality metrics will help you consider whether a solution is the right fit for you in terms of technology, service, and economics.