- IOC-based and TTP-based security testing each measure different things
- Change how Mimikatz dumps credentials, and prevention drops from 94% to 3%
- Inside the environment, prevention drops to 37%
- Closing the gap
- Read the full report
- Download the Blue Report 2026 to see how your industry scored and where to focus first.

By Sila Ozeren Hacioglu, Security Research Engineer at Picus Security.
A prevention score tells you what a control recognizes. It doesn’t tell you what that control stops.
Now in its fourth year, the Blue Report 2026 from Picus Labs measures how enterprise prevention and detection actually perform in production, across more than 338 million attack simulations run in real customer environments from January through June, 2026.
The headline is a genuine recovery, with a caveat: yes, prevention effectiveness rose from 62% to 69%, back to its 2024 peak.
But that number is a stack-wide average, and it masks a softer, more vulnerable interior.
The same controls that block a well-known attack tool let a quieter version of the same technique slip straight past your defenses. What decides the outcome isn’t the product in place, but how recognizable the attacker’s method is, and whether anyone tested for the quiet variant.
IOC-based and TTP-based security testing each measure different things
Whether a defense holds depends on which of two questions you put to it.
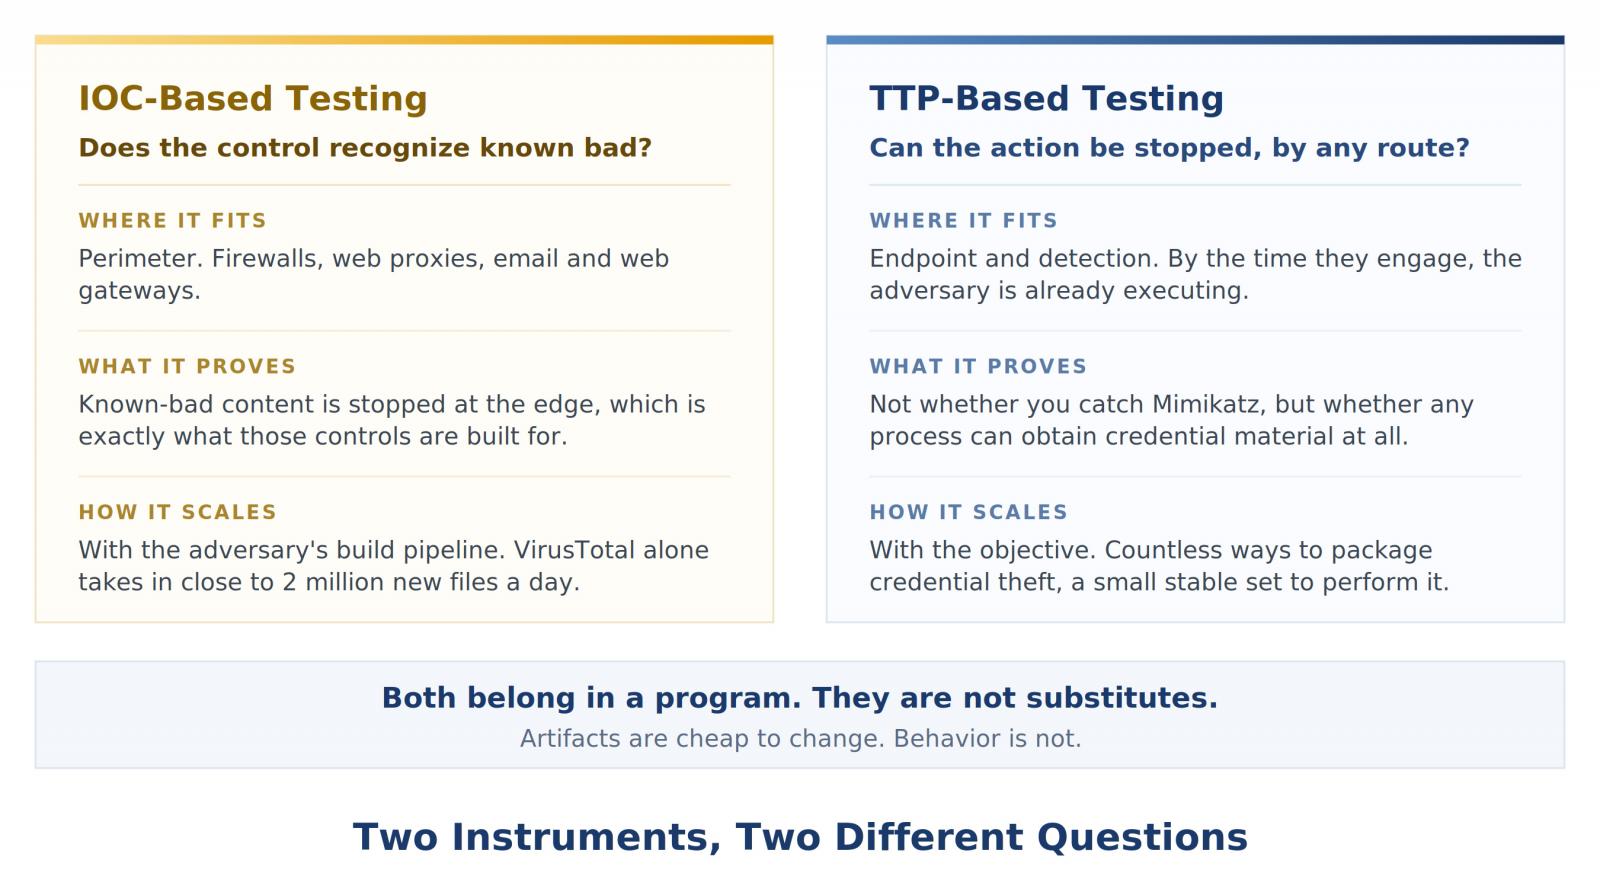
IOC-based testing asks whether a control recognizes known bad. Malware samples circulating in the wild are delivered as download attempts, and perimeter controls such as firewalls, web proxies, and secure email gateways either block them or don’t.
For this layer this is the right instrument: stopping known-bad content at the edge is what those controls are for.
Behavioral, TTP-based testing asks whether a control stops the action, by any route. Not “do you catch Mimikatz?” but “can a process on this host obtain credential material at all?”
That is the question endpoint and intrusion detection controls have to answer, because by the time they get involved, the adversary is almost always already executing.
Artifacts are cheap to change; behavior is not.
Yes, you need both. And yes, you should challenge the finance folks who’ll say you don’t.
The asymmetry is structural, and intentional.
Unfortunately, the edge is slipping too.
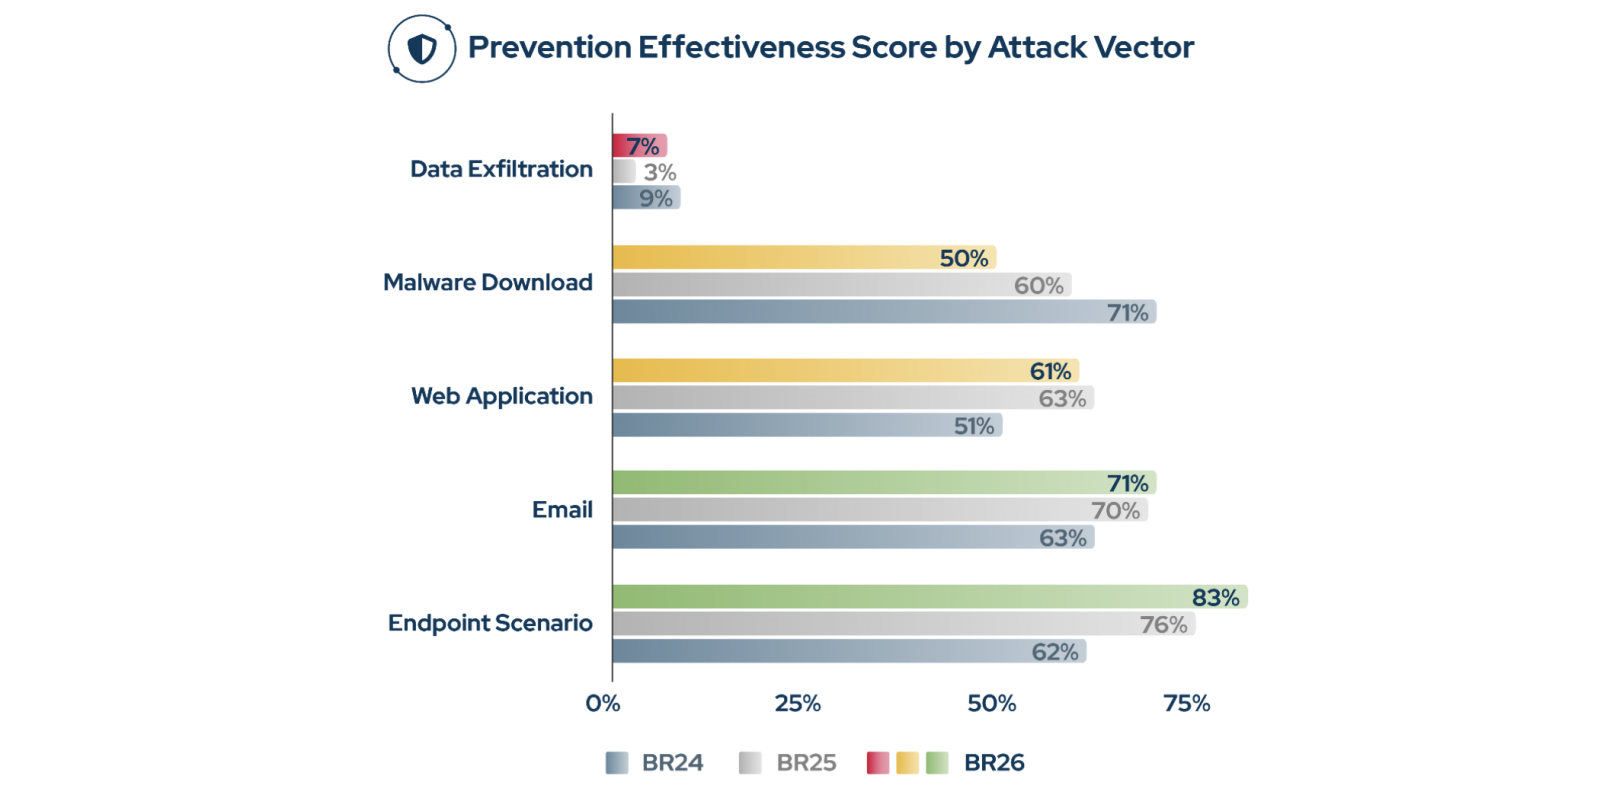
In this year’s data, the IOC-based prevention rate for malware downloads fell to 50% across customer environments, from 60% last year and 71% in 2024.
Even the layer that signatures cover best is giving way. And a passing score here says nothing about the behavior underneath, which is where the Mimikatz result comes in. Here’s a preview: it’s not good.
Your controls stop the version of the attack they recognize. Take the same behavior by a quieter route, and it walks through, while your last test still says covered.
See what your stack actually stops in the Blue Report 2026, and test the behavior instead of the procedure.
Download the Report
Change how Mimikatz dumps credentials, and prevention drops from 94% to 3%
With Picus Autonomous Penetration Testing, customer environments ran the same tool, Mimikatz, at the same objective three ways. The prevention scores were shocking, and could not have been further apart.
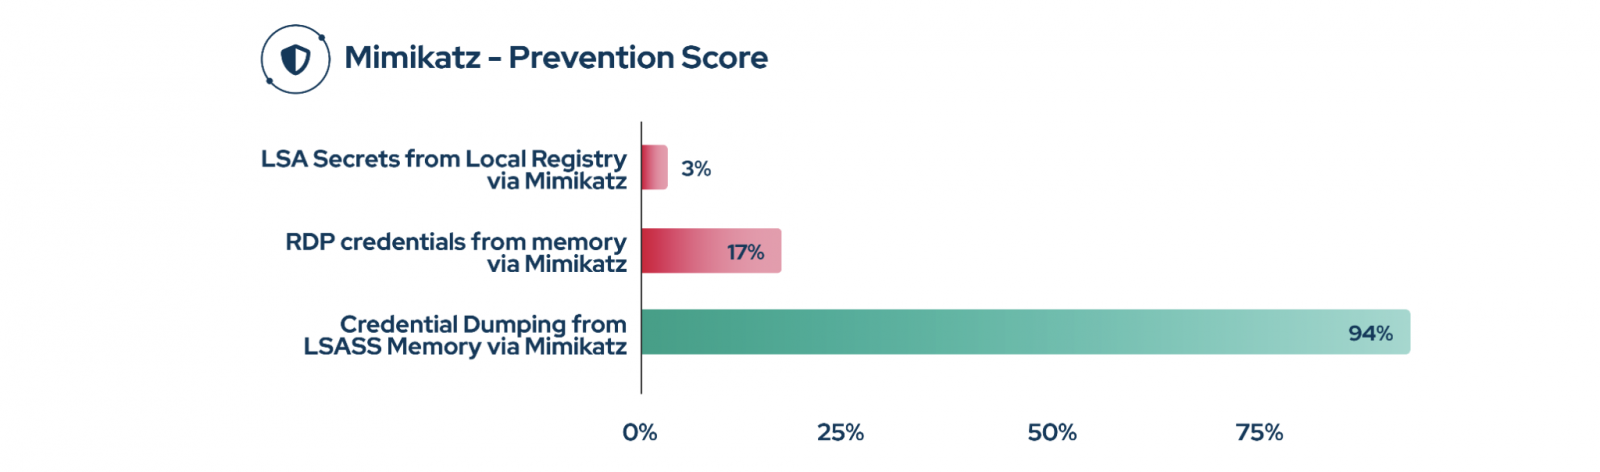
Dumping credentials from LSASS process memory, the classic and heavily signatured path, was blocked in 94% of attempts. Good.
Pulling RDP credentials from other memory locations with the same tool: 17%. Not good.
Reading LSA Secrets from the local registry: 3%. Appalling.
All three are siblings under one parent technique, OS Credential Dumping (T1003), and all three end with the attacker holding your precious credential material.
The only variable was how conspicuous the route was. In this case, Mr. Spock’s classic “live long and prosper” has morphed into “slip in quietly and succeed.”
The mechanics explain the spread.
The LSASS path is loud in a matchable way: a process opens a handle to lsass.exe and reads its memory, in other words, an event vendors have instrumented for years. Reading LSA Secrets never touches lsass; it runs as SYSTEM and reads a registry hive, indistinguishable from ordinary privileged activity. A control built around the first event has nothing to fire on for the second.
And even that 94% is thinner than it looks. It was measured against one known build of an open-source tool, whose recognizability lives in how it was compiled, not in what it does.
Rename the strings a signature keys on, or recompile it, and the hash and telltale markers become new.
Load it reflectively and the code never lands on disk to catch.
Or skip that build and take the same dump with a Microsoft-signed utility like ProcDump or comsvcs.dll, then parse it offline.
Each ends the same way, an attacker with your credentials in hand. The behavior never changes. Only the thing the signature was looking for does.
Inside the environment, prevention drops to 37%
Mimikatz is one behavior; the same split runs across the whole interior. The 69% overall Prevention Rate measures how well controls stop attacks at the boundary. Autonomous penetration testing measures something harder: what an attacker can actually accomplish once they’re inside as an “authenticated user.” Across the full set of those post-compromise actions, only 37% were blocked.
The perimeter stops two attacks in three; once inside, this falls to barely one in three.
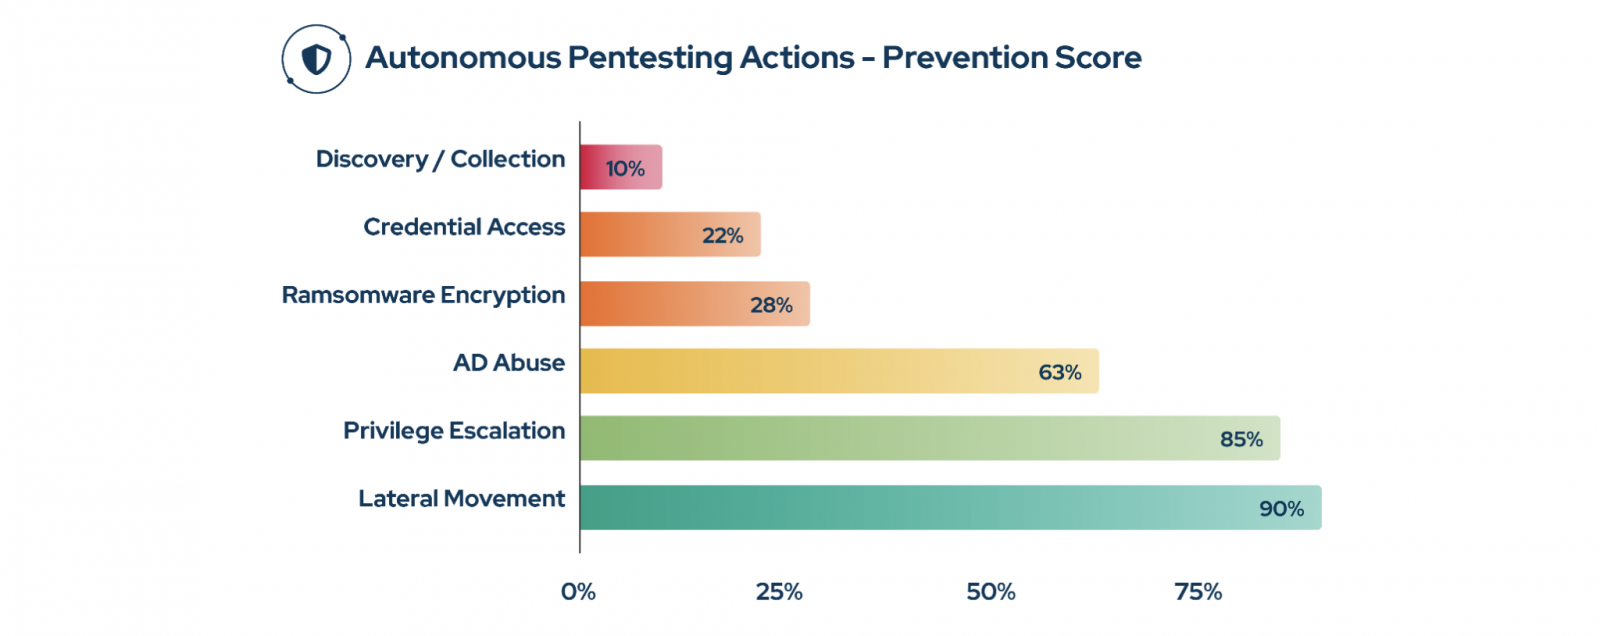
Loud actions were caught: lateral movement was discovered around 90% of the time, UAC bypass around 85%, credential reuse and Active Directory abuse around 63%.
Then, unfortunately, the floor drops out.
Credential material read passively from memory and the registry: 22%, with local registry secret extraction blocked in? Less than 1%. Discovery and collection: 10%, SharpHound domain enumeration and local file collection run almost entirely unopposed.
That 22% is the registry variant at scale, and the 10% is the same profile: with nothing for an indicator to bind to, it’s full-on, unfettered progress toward the attacker’s objective.
Closing the gap
Run both, and read each for what it measures.
Known-bad testing is the baseline for perimeter controls: firewalls, web proxies, WAFs, secure email gateways. They deliver known malicious samples as download attempts and check whether the edge blocks them, which tells you the perimeter is holding but nothing about the behavior underneath, and what happens inside.
Behavioral validation is the other half, and it belongs to the endpoint and detection layer: EDR, IDS, SIEM content. Proving credential access is covered means testing every route to it: LSASS memory, the registry, alternate memory locations, native tooling, recompiled builds.
Validate only the famous procedure and you close an item that’s actually still open, the most dangerously incorrect verdict a validation program can produce.
Doing that by hand doesn’t scale, which is where Picus Swarm comes in: the orchestration layer that runs the many behavioral variations of an attack across your environment and validates each against the controls you’ve deployed, so coverage is proven by the behavior, not by the one procedure a signature already recognizes.
Ready, finally, for some good news? None of this calls for a bigger stack. It calls for knowing which controls you already own will break the chain, so every exposure becomes a decision you can defend: Patch, Mitigate, Monitor, or Accept with Evidence.

Read the full report
The findings above represent just one thread in The Blue Report 2026, Picus Labs’ fourth annual study of how enterprise prevention and detection hold up in production, not in a lab.
There’s much more inside:
How your industry and region actually scored this year.
The year’s most-exploited vulnerabilities, most stopped in under 25% of attempts.
The threat groups and ransomware prevention lost the most ground to.
The detection failures behind a 58% log score and a 14% alert rate.
Download the Blue Report 2026 to see how your industry scored and where to focus first.
Sponsored and written by Picus Security.